Data selection from flight paths
One part of the COBECORE project focusses on valorization of old aerial photography data as gathered throughout DR Congo circa 1958. The data was gathered along flight paths running west to east. Along a flight path continuous images were taken. The image data provides information on canopy structure (and by proxy function). A first step in the process of valorization is the selection of the data to be prioritized for digitization.
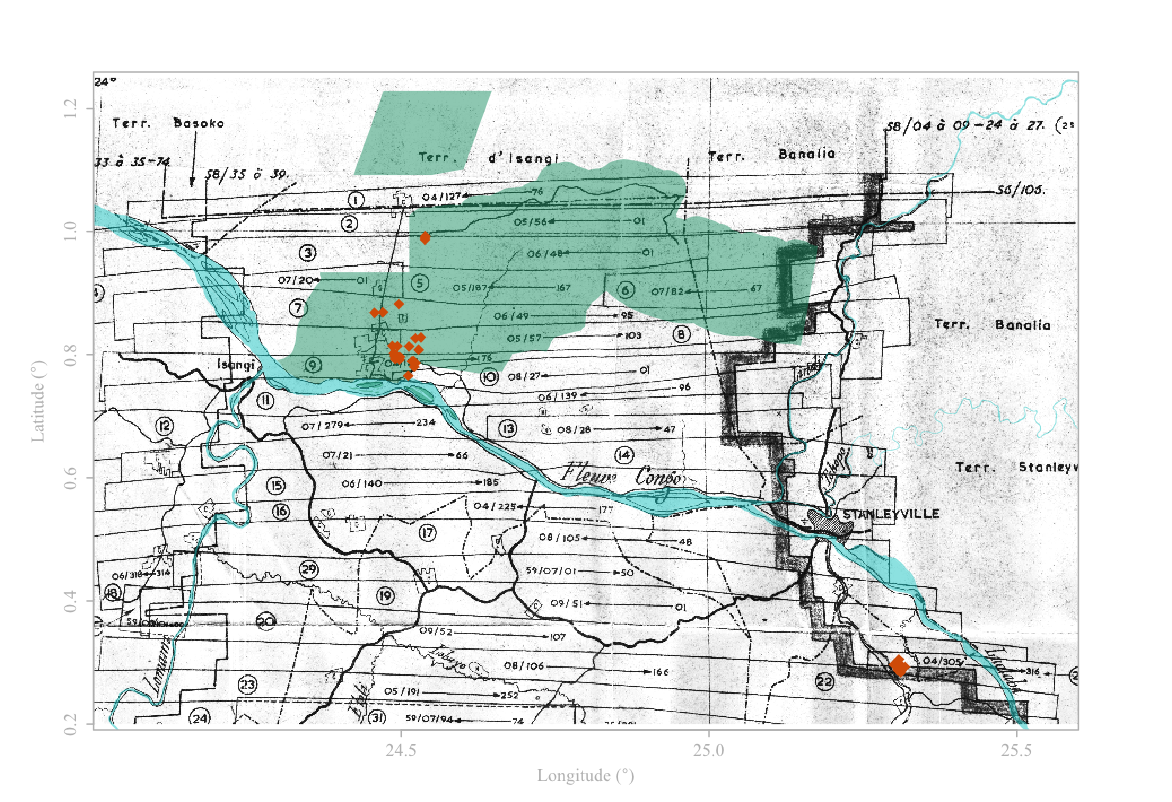
COBECORE will prioritize those areas which are covered by those areas (e.g. permanent sampling plots) under study within the context of current and future projects. Currently, there are ~30 permanent sampling plots scattered around the Kisangani region, with ~20 to the West in Yangambi and ~8 to the South in the Yoko forest reserve (see Fig. 1). Future campaigns will cover much of the Yangambi Man and Biosphere reserve with a regular grid of permanent sampling plots. As such, these areas will be prioritized during digitization and post-processing.
 |
The initial analysis of the intersection of regions and permanent sampling plots shows that COBECORE should focus first and foremost on the data in flight pats 1 - 11 and 21. These flight paths cover all Yangambi plots and most of the reserve, and the Yoko sampling locations. Depending on the workload required to properly geo-reference the images we will expand this analysis. The total image count for these 12 flight paths approximates roughly 300 images to be scanned at the limit of the optical resolution of both the medium (the grain of the print) and the scanner (whichever comes first).
Subsequent analysis will lead to the composites covering the selected areas. Below you see an example image of an exploratory analysis. The below image shows the potential to stitch individual images (3) into one continues images. In this case the techniques used are similar to the software stitching images into a panorama on your cellphone.
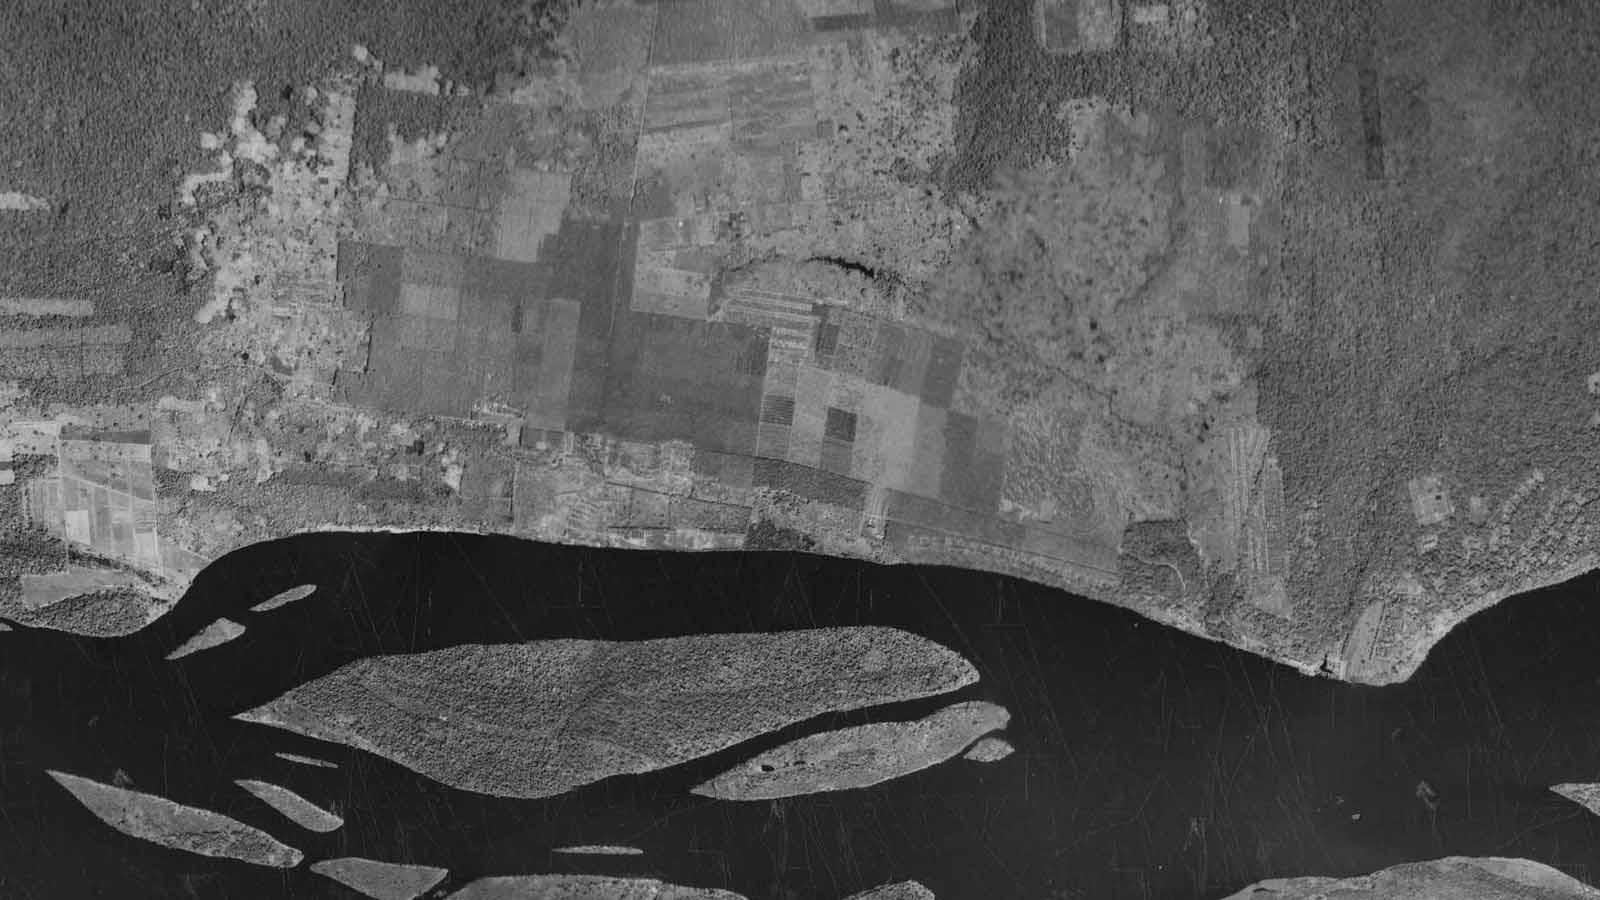 |
BLOG
pre-processing aerial_photography