Template matching data tables
Big tables, big problems
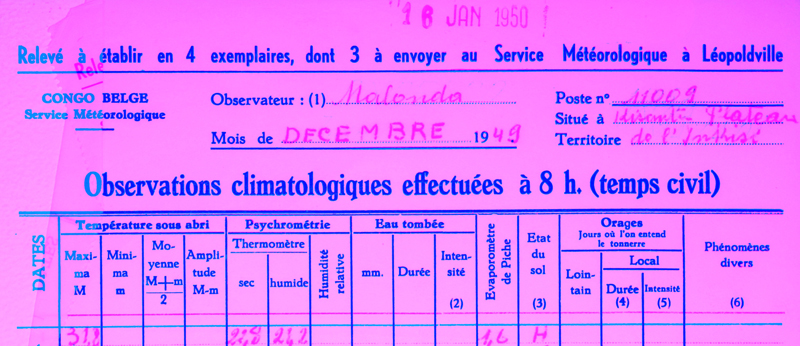
With all images scanned and sorted the next step involves the transcription of the images into meaningful, machine readable, data. Due to the complexity of the data, such as various handwriting styles in faded or runny ink, automating this process is very difficult. We will therefore aim to crowdsource the transcription of the data. Yet, large tables are difficult to transcribe as the location within a table is of importance, and not only the values. As such, mistakes are more easily made when transcribing tables as a whole.
Template matching
To resolve the issue of size we will cut the table into its individual cells using a technique called template matching. In this application the technique uses an empty table, with known properties such as cell locations, as a template. The tables containing data are then matched to this template to allow for the extraction of the data. Such an approach is commonly used to automatically process various forms, for example standardized tests. In general these computer science problems are broadly covered by the field of pattern recognition.
In our case we will use the Oriented FAST and Rotated BRIEF (ORB) feature matching algorithm to calculate correspondence between the empty template and an image of a table containing data (Fig 1.). These features make it possible to calculate the homography, or projective geometry of one image to the next.
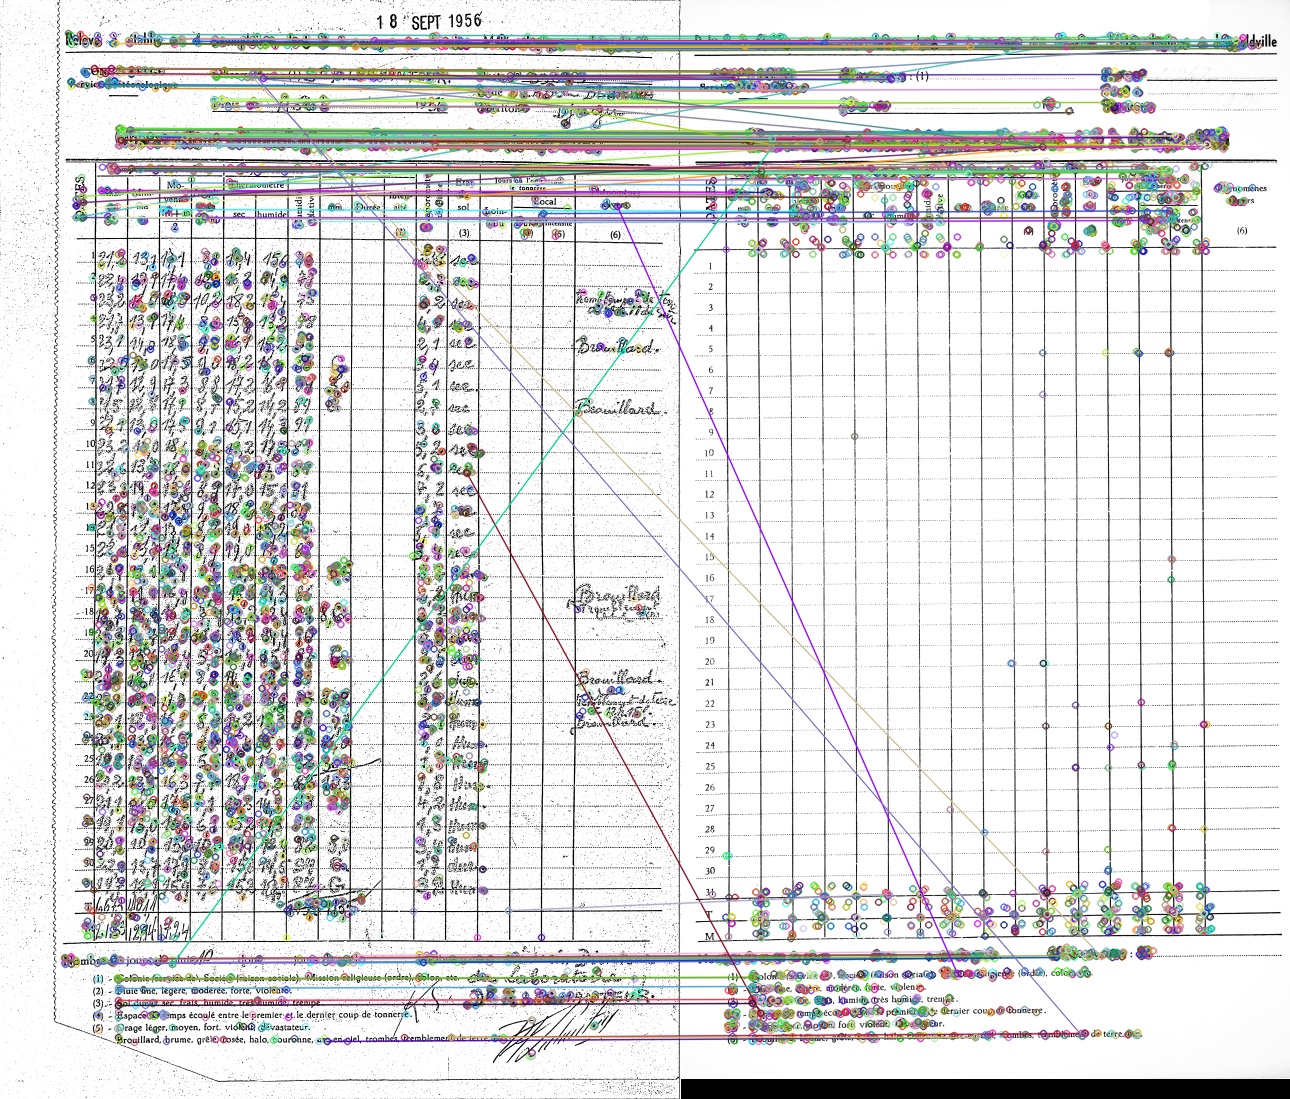 |
If good correspondence is established we can transform the image containing data to align (perfectly) with the template. Below (Fig 2.) and example is given where the transformed data is shown in red/pink tints, the template is shown as light blue, the image is dark blue where there is correspondence between both images. Note how light blue, template, header texts transition into an almost perfect correspondence with the image which contains data.
 |
This correspondence allows us to measure the location of the individual cells in the template table once, and transfer these measurements to the aligned table containing data. With this match it is now possible to extract individual cells in the table for easier processing (using crowdsourcing or otherwise) with limited effort, scaling an otherwise tedious manual if not impossible task.
BLOG
data_recovery digitization citizen_science