Automated data coverage statistics
Last week I finished the pre-processing code for aligning and screening the COBECORE digitized records. Friday I ran the alignment and classificatoin routine on “format 1” one of the more common data sheet formats in the dataset, which covers the 1950s. Today I processed some of the meta-data produced during the process.
During alignment of the 10K+ scans cell values are not only screened for the presence of data, this meta-data is also retained to get an idea of the transcription data load and transcription tasks in the upcoming citizen science project. Here I provide some of these statistics for those sites which could be matched to a proper site ID as noted in the Belgian State Archive index.
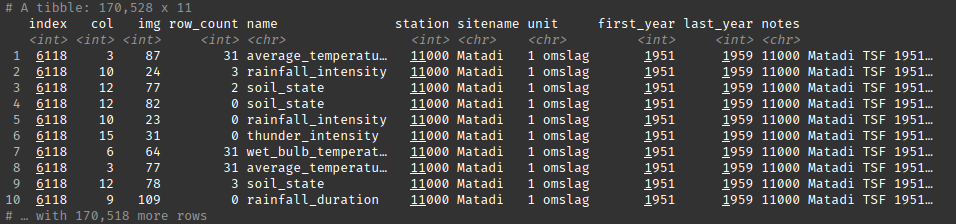
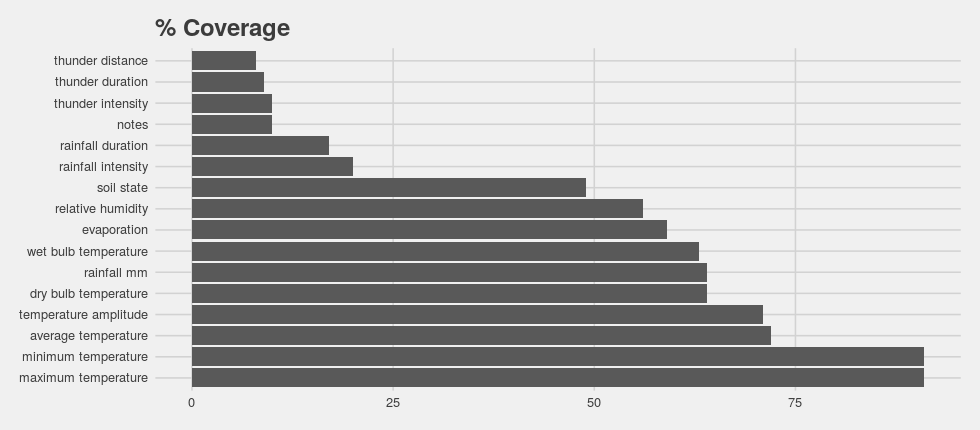
After processing the 10 720 scans some 5.3 million cells were evaluated for data coverage (%), as reported in the bar graph below. Only considering data on a monthly level (counting months with 10 days or more of values as complete), high coverage was noted for minimum and maximum temperature (and derived values) with coverage in the low 90%. Values which serve to calculate relative humidity (wet and dry bulb temperature), as well as rainfall data covered roughly >60% of all months analyzed. While evaporation data and soil conditions report incidences lower than 60%. Notes and data on thunderstorms (noise), as well as meta-data on rainfall data such as the duration and intensity, were reported in 20% or less of the months.
This summary provides some insight into what data is available and what can be expected after data recovery in terms of data coverage. As expected, simple measurements of temperature and rainfall are well covered. In format 1 it seems that values of relative humidity will also be fairly common.
BLOG
data_recovery digitization citizen_science meta-data