Finding empty cells in tables
A large (empty) workload
A previous blog post outlined how the +70K scans present an inssue when it comes to processing and extracting data. Due to template matching a large part of these issues have been automated away. Yet, even when the data can be extracted one hurdles remains, empty cells in table.
Our digitized tables are sparse. This means that the bulk of the data in the tables consists of empty table cells, while the remaining part is true valuable data. Since transcription will rely on a pair of human eyes evaluating every single cell of data it is obviously a waste of time to review what are empty cells. A solution has to be found to quickly and accurately screen these empty cells, and remove them from the final data set to limit the workload (not wasting time of volunteers).
Tensorflow transfer learning
During a previous project transfer learning, based on the Tensorflow framework, provided a fast solution for a simple classification task. Transfer learning is a way of rapidly training a complex image processing model by leveraging the efforts of previous researchers. Previous research groups have created models which are tuned using a large selection (many millions) of labelled images. This model therefore includes a fairly good representation of what you might encounter, and want to label, in the real world. In transfer learning we use this existing model and tune it further to a specific use case. This is often far faster than creating your own model, which also requires vast amounts of data.
We use the transfer learning approach to classify cells of the digitized tables as either empty or complete (Fig 1.). To do this the cells of 3 tables with varying handwriting or typed numbers were extracted using the template matching approach, as previously described. This left us with training data of ~1400 cell values (split evenly among the two types). This data was used to retrain the model for our use case.
 |
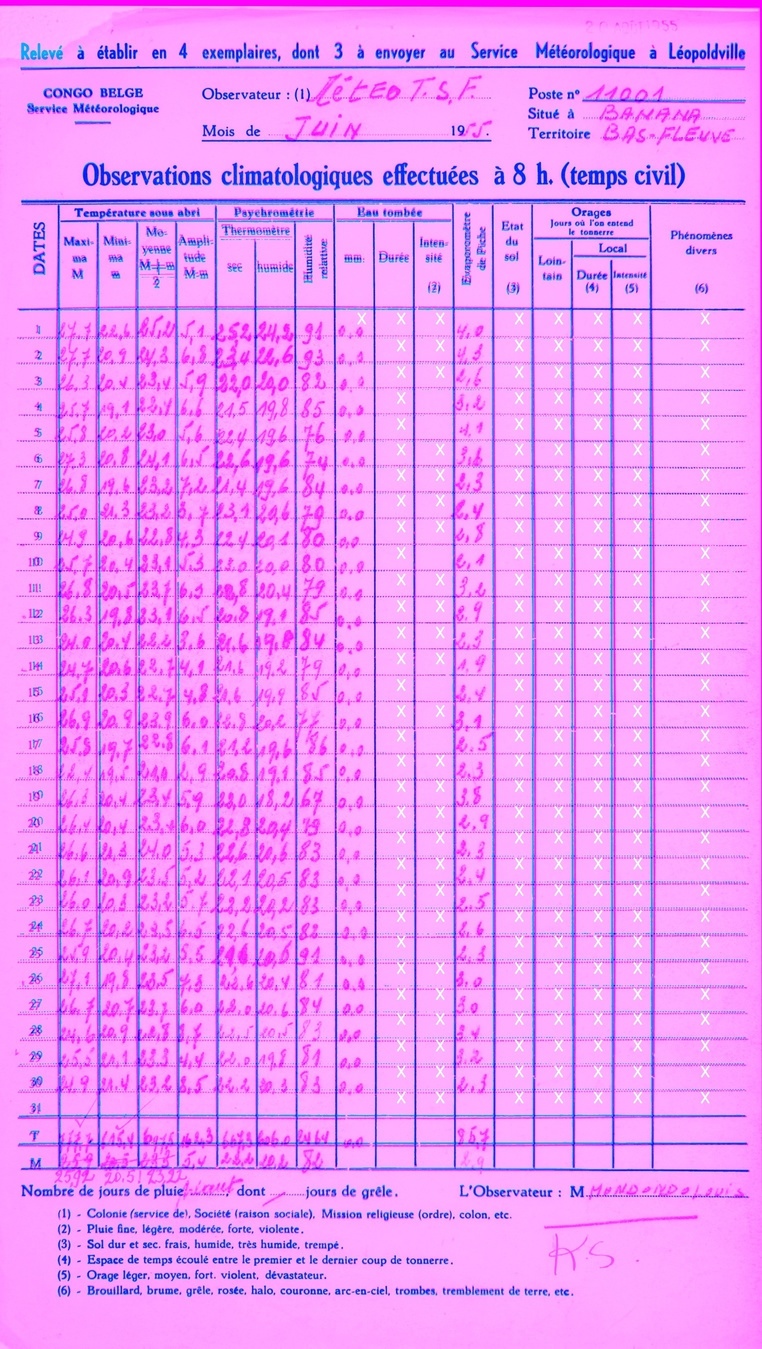
After retraining the model had an accuracy of ~98%. For the task at hand this is sufficient, as additional screening based upon column wide statistics will be made. A visualization of the classification results of one particular table are given below (Fig 2.). The template matching visualization is used, where light blue pixels represent those of the template, red/pink pixels represent those of the matched table, blue pixels show agreement between the template and the matched table and, finally, white crosses indicate empty cells as predicted by our Tensorflow model.
In the below table we see only few misclassified cells. In particular we find one false positive, claiming to be empty when it is not, and six false negatives, where empty cells are not flagged. With over 400 values in the table and an accuracy of ~98% having an error rate of seven values is roughtly what you might expect.
 |
BLOG
data_recovery digitization citizen_science meta-data
